What Analytics Should I Be Looking At?
First things first – do you have analytics on your website? While there are other platforms, we are dealing specifically with Google Analytics in this article. To check if your site has Google Analytics installed:
- Open your browser and go to your website
- Right click on the screen and click “View Page Source”
- Once you have the page source open, click CTRL + F at the same time to bring up a search
- In the search, type Analytics
- If the search returns 0/0 results, you do not have Google Analytics installed on your site. If the search highlighted a section on your site that looks similar to the one below, yay! You at least have analytics installed.

If you do not have Google Analytics installed on your site, that should be step one. Google Analytics is free and is fairly straightforward to add to any site. To create an account, head over to https://analytics.google.com. Once you set up the account, you will be given a tag or snippet of code to add to the code of your website. Many content management systems (like WordPress) make it easy for non-developers to add the tracking code to the site. If you are unsure on where to add the code, check with your web developer for instructions. If you have just set up your analytics account, it can take up to 48 hours to start tracking data once the code is installed.
If your search returned that you do have Google Analytics installed on your site, that’s great. Now you need to locate your account information and login. You will login at https://analytics.google.com. Now that you have access to your account, we can get to the real meat of this article…
What Analytics Should I Be Looking At?
Without measuring, marketing is a total guessing game. Being able to track how many people are coming to your site and what they are doing while there can help you create more targeted marketing and cut out marketing that may not be working for you online. Open up your Analytics account and follow along as we jump to different sections that show valuable marketing data.
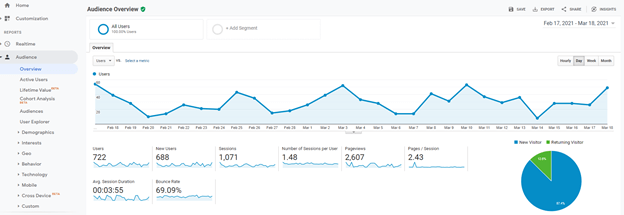
Audience Overview – From the left panel of Analytics click on Audience and then click on overview. This will show you the number of users for a given period of time. You can change date range for the displayed data from the upper right corner. I like to look at a 30-day history to get a bigger picture of any trends we may be seeing. Your Audience Overview will tell you the following data:
- Users – the total number of people who have come to your site in the selected date range.
- New Users – number of users who are new to your site.
- Sessions – If this number is higher than your user number (and it should be), this means that some of the users have returned to your site more than once or viewed more than one page during the time frame.
- Page Views – this shows the number of pages that were viewed by the user count. If you divide this number by the session number, you will get your average page view by user. If you have a single page website, this number will be similar to your session count. However, if you have multiple pages, ideally this number will be significantly higher than the session number.
- Bounce rate – The bounce rate shows the percentage of people who enter and exit off the same page without navigating else where on the site. Again, if you have a single page website, your bounce rate will be very high as everyone will enter and exit off the same page. A high bounce rate can be a bad thing if the success of your site depends on someone working their way through the pages to convert. If you have a multi-page website and a high bounce rate, look at where your traffic is coming from to determine if there is a reason for the bounces. If you’re running an Ads campaign that leads to a non-relevant landing page (running an ad for Website creation but sending people to the Social Media page when they click on the ad) you may just need to tweak a few things to bring the bounce rate down a bit. Also take a look at your calls to action (CTA). If your CTA is weak and/or missing, people won’t know what to do next on your site and will likely bounce off to find an easier solution.

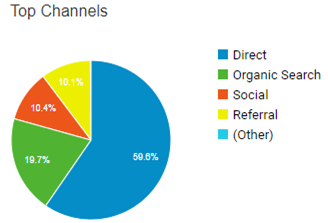
Acquisition Overview – To access this report, on your Analytics dashboard, from the left click on Acquisition > Overview. This report will give you an idea of where your traffic is coming from. By default, Google Analytics organizes acquired website traffic into 9 channels: Direct, Organic Search, Referral, Email, Paid Search, Other, Social and Display.
- Direct – Traffic that is coming directly to your site via your website address.
- Organic Search – Traffic that is coming from a search in Google.
- Referral – Traffic that is coming to your site from another website. This is a good report to dive deeper on to help you identify what partner programs are working to drive traffic to your site.
- Email – If you have integrated analytics into your email marketing platform, traffic that comes from your email marketing will be registered here.
- Paid Search – The traffic coming to your site from your Google Ads campaign (if applicable).
- Other – The traffic coming from a source that cannot be immediately placed into another channel bucket by Google.
- Social – Traffic that is coming from a social media (Facebook, Twitter, Instagram, Pinterest, etc.).
- Display – If you are running a display ad campaign, this traffic will be reported here.

To dive deeper, you can click on each of the channel types to see more details. In the screen shot below, we have clicked on the Social channel to see what social platform is providing the most traffic to our site.

Top Pages – To view what pages are getting the most traffic on your site, click on Behavior > Site Content > All Pages from the menu on the left in Analytics. The Site Content report gives a quick overview of the most popular pages and sections of a website. You can quickly identify whether users are getting to the pages you want them to and make marketing decisions based on the results.

Devices – To view what device people are viewing your website on, click on Audience > Mobile > Overview from the menu on the left in Analytics. With more and more folks accessing websites via their phones, this is an important report to see how traffic from different sources are interacting with your site. A 7-day report from our Analytics is below.

Not surprisingly for us, most of our traffic comes from a desktop. We are a business-to-business company and while more and more people are doing research outside of working hours (which would indicate a spike in mobile) most research and communication is happening during regular office hours at a computer. Our bounce rate on mobile is higher than desktop. At first this stat makes me panic a little, but then if I look at our customer behavior, most of the people coming to our site from mobile are likely looking for a phone number. If you come to our site from your mobile phone and click the call button, then leave the page after you speak to us on the phone, that will count as a bounce even though you were able to successfully get what you needed. The average session duration on mobile is also short which seems to validate my explanation of looking for a phone number.
These are just a few of the dozens of reports you can run in Google Analytics. You can get lost looking through all of the data and some of the terms used in Analytics can be a little confusing. If you’re just starting out, stick with the reports we’ve outlined above to have a high-level overview of how your site is working.
Having the data is only half the battle… knowing what to do with that knowledge is the hard part. While it’s important to view the reports on a regular basis taking action based on the data is going to be what creates meaningful results.
If you’re not using Analytics or aren’t sure what to do with the data you’re looking at, let us know. We’d be happy to help.
